

The Commodity Futures Trading market offers opportunities for traders looking to participate in global markets such as gold, crude oil, natural gas, silver, wheat, and other essential commodities. However, commodity prices can change quickly due to supply-demand shifts, economic events, geopolitical factors, and market sentiment.
To make informed trading decisions, many traders use technical analysis. Technical indicators help identify price trends, momentum, volatility, and possible entry or exit points.
While no indicator can predict the market with complete accuracy, combining the right tools with proper commodity trading risk management can help traders develop a more disciplined approach.
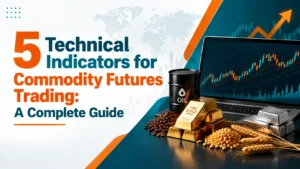
In this guide, we will explore the 5 most important technical indicators for commodity futures trading, how they work, and how traders can apply them in real market conditions.
What Are Technical Indicators in Commodity Futures Trading?
Technical indicators are mathematical tools that analyze historical price data, trading volume, and market behavior. Traders use these indicators to understand market trends and identify potential trading opportunities.
The commodity futures market is highly influenced by factors such as:
- Global supply and demand
- Currency movements
- Inflation data
- Interest rates
- Weather conditions
- Economic reports
Unlike traditional investments, commodities often experience strong price cycles. This makes technical indicators useful for traders who want to understand market direction and timing.
Before applying indicators, traders should understand the basics of commodity trading and how futures markets operate.
Why Use Technical Indicators in Commodity Futures Trading?
Technical indicators help traders answer important questions:
- Is the commodity price trending upward or downward?
- Is the market gaining or losing momentum?
- Is volatility increasing?
- Is the current price movement sustainable?
- When should a trader enter or exit a position?
Successful traders do not rely on indicators alone. They combine technical analysis with market research, trading strategies, and risk control.
For example, understanding how to invest in commodities requires knowledge of both market fundamentals and technical signals.
1. Moving Averages (MA): Identifying Market Trends
Moving averages are one of the most commonly used indicators in Commodity Futures Trading.
They smooth price fluctuations and help traders identify the overall market direction.
There are two popular types:
Simple Moving Average (SMA)
A Simple Moving Average calculates the average closing price over a specific number of trading periods.
Example:
A 50-day SMA shows the average price of a commodity over the previous 50 trading days.
Exponential Moving Average (EMA)
An Exponential Moving Average gives more weight to recent price movements, making it faster at responding to market changes.
How Traders Use Moving Averages
Identifying Trends
- Price above the moving average → possible bullish trend
- Price below the moving average → possible bearish trend
For example, if gold futures consistently trade above the 200-day moving average, traders may view the market as having long-term strength.
Moving Average Crossover Strategy
Many traders use crossover signals:
Golden Cross
A shorter moving average crosses above a longer moving average, suggesting possible upward momentum.
Death Cross
A shorter moving average crosses below a longer moving average, indicating possible downward momentum.
Moving averages are especially useful when combined with other commodity futures trading strategies.
2. Relative Strength Index (RSI): Measuring Market Momentum
The Relative Strength Index (RSI) measures the speed and strength of price movements.
It operates on a scale from 0 to 100.
Generally:
- Above 70 = Overbought conditions
- Below 30 = Oversold conditions
How RSI Works in Commodity Markets
Commodity prices can rise or fall quickly. RSI helps traders understand whether a market movement may be losing momentum.
Example:
If crude oil futures experience a rapid price increase and RSI moves above 70, traders may consider whether the market is overextended.
If silver futures decline sharply and RSI falls below 30, traders may watch for potential recovery signals.
RSI Divergence
One advanced RSI strategy is divergence.
Bullish Divergence
Occurs when:
- Price creates lower lows
- RSI creates higher lows
This may indicate weakening selling pressure.
Bearish Divergence
Occurs when:
- Price creates higher highs
- RSI creates lower highs
This may suggest weakening buying momentum.
3. Moving Average Convergence Divergence (MACD): Finding Momentum Changes
MACD is a popular indicator used to identify changes in market momentum.
It compares two exponential moving averages and consists of:
- MACD line
- Signal line
- Histogram
How MACD Helps Commodity Traders
When the MACD line crosses above the signal line, it may indicate increasing bullish momentum.
When the MACD line crosses below the signal line, it may indicate increasing bearish momentum.
Example:
A trader analyzing natural gas futures may use MACD to identify whether a current price recovery is gaining strength or simply a temporary movement.
MACD works best when combined with trend indicators and proper commodity risk management.
4. Bollinger Bands: Understanding Commodity Market Volatility
Bollinger Bands measure price volatility and consist of:
- Middle moving average
- Upper band
- Lower band
The distance between the bands changes based on market volatility.
How Traders Use Bollinger Bands
High Volatility
When bands expand, it indicates increased price movement.
This often happens during major economic announcements or supply disruptions.
Low Volatility
When bands become narrow, it may indicate a potential breakout opportunity.
Bollinger Band Trading Example
Suppose crude oil futures trade within a narrow range for several weeks.
A Bollinger Band squeeze may indicate that a significant price movement could happen soon.
Traders often combine this signal with volume and momentum indicators before entering trades.
5. Average True Range (ATR): Managing Trading Risk
Average True Range (ATR) is a volatility indicator that measures average price movement over a specific period.
Unlike RSI or MACD, ATR does not predict market direction. Instead, it helps traders understand risk.
Why ATR Matters in Commodity Trading Risk Management
Commodity markets can experience large price swings.
ATR helps traders:
- Set realistic stop-loss levels
- Adjust position sizes
- Understand market volatility
- Avoid unnecessary exits
Example:
If crude oil has a high ATR value, traders know that larger daily price movements are normal and can adjust their risk accordingly.
Proper commodity trading risk management is essential because even strong technical signals can fail during volatile market conditions.
How to Combine Technical Indicators for Commodity Futures Trading
Professional traders rarely depend on one indicator.
A common approach combines different indicator categories:
Step 1: Identify Market Direction
Use:
- Moving averages
Step 2: Confirm Momentum
Use:
- RSI
- MACD
Step 3: Measure Volatility
Use:
- Bollinger Bands
- ATR
This approach helps traders create balanced commodity futures trading strategies instead of making decisions based on a single signal.
Common Mistakes When Using Technical Indicators
Using Too Many Indicators
Adding too many indicators can create conflicting signals.
Focus on a few tools that complement each other.
Ignoring Market Fundamentals
Technical analysis is important, but commodity prices are also affected by:
- Economic data
- Production levels
- Global events
- Supply disruptions
Poor Risk Management
Even experienced traders face losing trades.
Always include:
- Stop-loss planning
- Position sizing
- Risk-reward analysis
5 Best Technical Indicators for Commodity Futures Trading: Quick Summary
Indicator | Main Purpose |
Moving Average | Identify market trends |
RSI | Measure momentum |
MACD | Detect trend changes |
Bollinger Bands | Analyze volatility |
ATR | Manage trading risk |
Final Thoughts
Understanding technical indicators can help traders make better decisions in the Commodity Futures Trading market. Moving averages identify trends, RSI measures momentum, MACD detects market shifts, Bollinger Bands analyze volatility, and ATR supports effective risk management.
However, successful trading requires more than indicators. Traders should combine technical analysis with market knowledge, disciplined execution, and a clear risk strategy.
Whether you are learning how to trade commodity futures or improving an existing strategy, mastering these indicators can help you analyze market opportunities with greater confidence.
For deeper insights into market movements, explore commodity trading strategies and learn how professional traders approach different market conditions.